What to Know About Weather Patterns in San Jose, CA
San Jose, CA weather patterns run wet from November to March, then dry. With a 17-day median sale pace, check roofs and drainage before writing an offer.
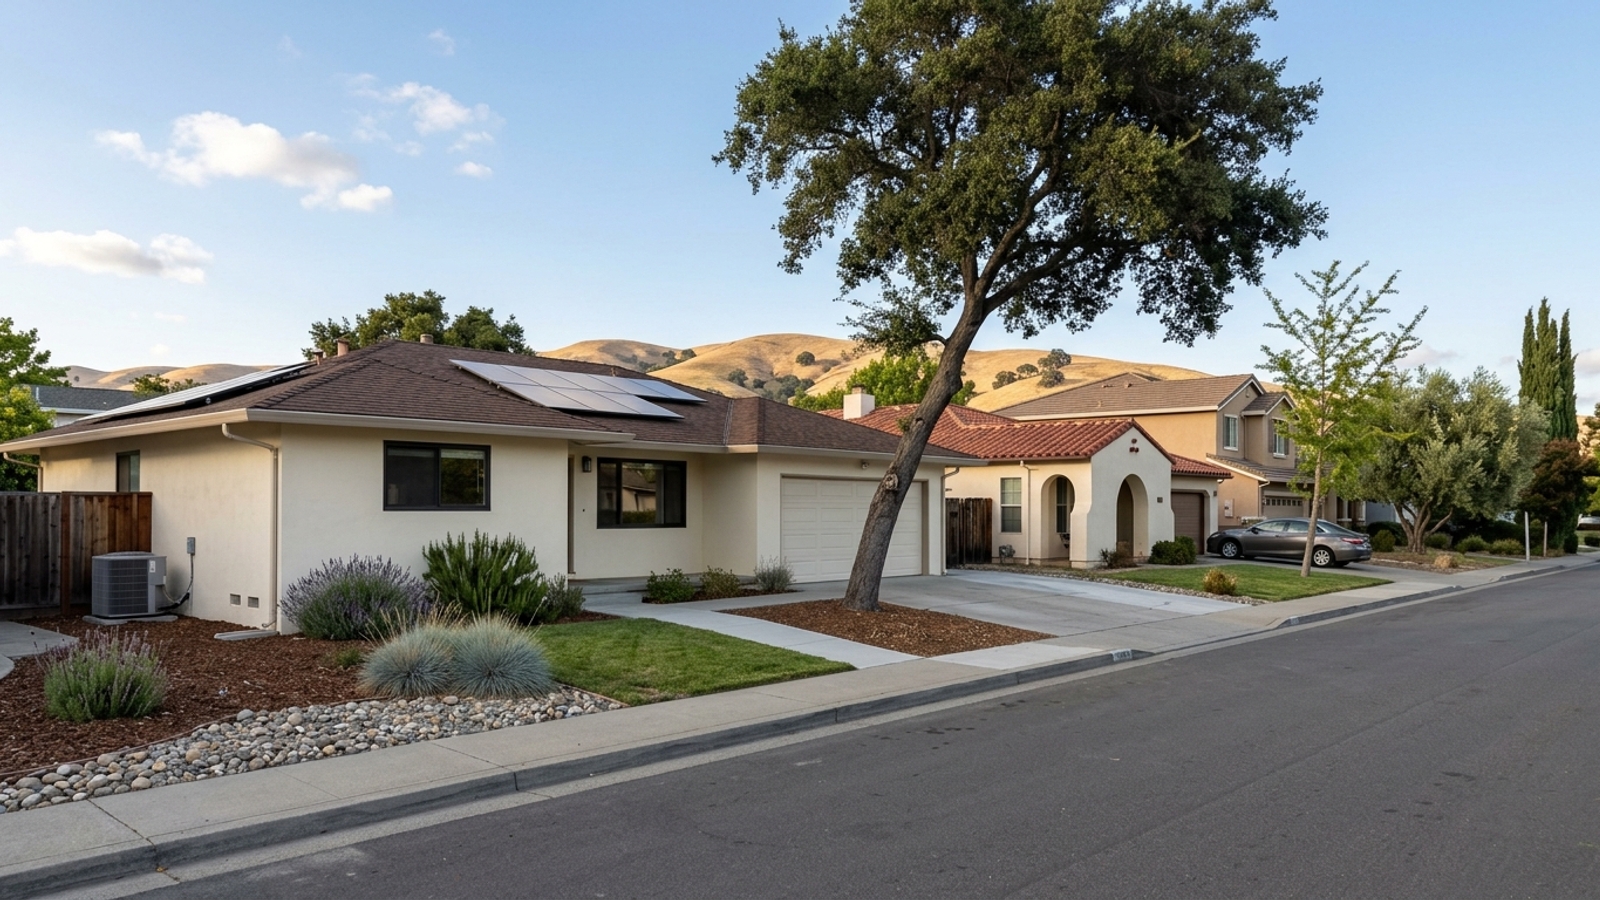
San Jose runs on two seasons, not four: wet and dry. Nearly all of the city's rain falls between November and March, which means the timing of your home search changes what you can see. Tour in winter and you'll watch how a property handles runoff. Tour in summer and you'll see the house at its driest and hottest, with no rain in sight to test the gutters.
That cycle shapes the local real estate calendar in real ways. During the dry season window of the 90 days ending September 30, 2026, single-family homes sold at a median of 17 days at 101.9% of list price. Drainage, roof, and cooling checks don't happen on their own, so you have to plan them deliberately. Condos took a median 42 days to sell during the same period, which at least buys you time to be deliberate about it.
Key takeaway
San Jose has a mild Mediterranean pattern: a cool, wet season from roughly November through March and a long dry season the rest of the year. Summer afternoons run warmer away from the bay. If you tour during the rainy months, you can see exactly how a home handles water. If you buy in the dry season, when single-family homes sold in a median 17 days, plan your roof, drainage, and cooling checks before you make an offer.
Who this guide is for
You're weighing a move to or within San Jose and want to know how its weather pattern should shape when you tour, where you look, and what you check in a home.
What to expect from San Jose's weather patterns
San Jose falls under the Köppen climate classification as a warm-summer Mediterranean climate. The city averages 13.83 inches of rain annually, with the vast majority arriving between November and March. January alone averages 2.77 inches.
The Santa Cruz Mountains to the west and the Diablo Range to the east create a rain shadow over the Santa Clara Valley. Those hills block many incoming storm systems, which is a big part of why summers here are warm and dry. By most measures the weather is mild, though the dry season brings its own set of heat and fire risks worth understanding before you buy.
The practical consequence of this cycle is that most homes go on the market and sell during months with almost no rain. A buyer evaluating a property in June or July won't see how the gutters perform in a downpour. The weather pattern forces you to rely on inspections and disclosures for water issues rather than anything you can observe yourself.
San Jose weather by season
The wet season runs November through March. Temperatures drop, storms arrive in clusters off the Pacific, and frosty mornings are possible. The surrounding hills turn bright green from the moisture.
Spring is a transition. The valley dries out, the green hills start to fade, and afternoon winds pick up across the area. By June the dry season has settled in: warm to hot days, cool nights, near-zero rainfall. The July normal high reaches 82.2°F, while the normal low drops to 59.1°F.
Fall often delivers the warmest spells of the year. Heat waves tend to arrive in September and early October before the first winter rains return, so a September tour can reveal how a property handles peak heat better than a July tour can. Normal averages obscure the extremes. A single hot or wet year can differ sharply from whatever the baseline suggests.
How weather varies across San Jose
San Jose's weather shifts depending on exactly where you stand in the valley. An afternoon sea breeze off San Francisco Bay cools the northern, bay-side parts of the city first, keeping temperatures a bit lower during the hottest part of the day.
South and east areas near the foothills sit farther from the water. Those neighborhoods tend to run warmer on summer afternoons and cooler on winter nights. You can review local zip codes and neighborhood profiles to understand where a specific home sits relative to the bay and the hills.
There are no official neighborhood-level climate normals, so you'll have to do your own testing. Visit shortlisted streets at the same hour on a hot afternoon and pay attention to the wind, heat, and shade. Walking a block at 4:00 PM in August tells you more about a home's sun exposure than any map will.
Rain, drought, and flooding in San Jose
Rainfall in a given California water year, which runs October 1 to September 30, swings wildly. The area has seen severe drought years and storm-heavy winters, sometimes in close succession. A home that looked perfectly dry through a three-year drought may never have been tested by serious rain.
When major storms hit, water levels rise fast. The February 21, 2017 Coyote Creek flood was the highest flood event observed since Anderson Dam was constructed in 1950. The local water district is currently working on a protection project to reduce flood risk along roughly nine miles of the creek, aiming to manage water up to that 20-year flood level.
Look up any prospective address on FEMA's flood map and read the seller's disclosures for past water intrusion. You can also review local safety data to see how natural hazards map across the city. Drought years bring water-use rules and brown yards, so a lush lawn in a listing photo says very little about what that property looks like in a typical summer.
Heat, wind, and wildfire smoke
Heat waves in the Bay Area cluster in late summer and early fall. The all-time record high at the San Jose Airport is 108°F, reached in both July 1972 and July 1905. The hottest days typically peak between July and early October.
Wildfire smoke can drift into the valley from fires elsewhere in the state. During 2026, the Bay Area Air Quality Management District issued multiple smoke advisories related to the Cooley, Woodside, and Timber/Plaskett fires. Those advisories covered the broader region rather than San Jose specifically, but the smoke still affects local air quality.
Cooling and air filtration matter more than the mild annual averages suggest. Confirm whether a home has central air conditioning or another modern cooling system. For hillside properties, check the address on CAL FIRE's Fire Hazard Severity Zone map and review regional hazard data. The same dry, sunny pattern that makes summers pleasant is exactly what drives smoke and fire risk.
How San Jose's weather affects buying a home
The local real estate market moves fast during the dry season. In the 90 days ending September 30, 2026, single-family homes sold at a median of 17 days, leaving you little time to order extra inspections once you're under contract. Condos took a median 42 days to sell, which gives you room to come back after an early-season storm or ask the HOA hard questions.
At the single-family pace, you need to line up your roof, gutter, grading, and cooling questions before you write an offer. Ask the seller for the roof's age and repair records, have an inspector confirm that water drains away from the foundation properly, look for past water stains, and check the attic insulation. San Jose falls within California Energy Commission Building Climate Zone 4, which sets specific insulation and cooling standards for construction.
For condos and townhouses, ask the HOA what roof and exterior maintenance it covers and what its reserves look like. You can compare different property types to see which associations handle exterior water damage. If you want help timing tours around the rainy season, Andy Tse's team can walk you through it. A winter search exposes you to more weather but puts you in a different market environment, so checking current housing market trends is worth doing before you commit to a timeline.
Best time of year to move to San Jose
Moving in the dry season guarantees reliable weather for moving trucks and eliminates rain delays. The trade-off is dealing with peak heat if you schedule for late summer. A wet-season move risks storm days, but it lets you see exactly how the home's roof and drainage handle water from day one.
Sellers face their own seasonal timing choices. Dry-season listing photos will show yards that are either green or brown depending entirely on the drought year, and buyers increasingly ask about drainage during the summer months because they can't see the runoff themselves.
The best weather month and the best market month aren't necessarily the same. You can review the selling process to see how staging and disclosures shift by season, and tracking current market data gives you a better sense of when inventory peaks, regardless of what the forecast says.
How to use San Jose's weather in your home search
Your timeline and risk tolerance should dictate how you handle the local climate. These questions can help you shape your search:
- Will you be touring between November and March, or in the dry months? In the dry months, read the buying section above for the checks that stand in for seeing a home in the rain.
- Do you need time for a second look after a storm? If so, compare the condo figures in the at-a-glance list with single-family ones, then review the buying section.
- Are hot summer afternoons a deal-breaker? Read the microclimates section and visit shortlisted streets at the same late-afternoon hour.
- Are flood or wildfire-smoke exposure on your list? Read the rain and heat sections, then check local hazard data.
If you want time to see how a home handles rain before committing, start with condos, because they took a median 42 days to sell and went for 98.6% of list, leaving room for a second visit after a storm and questions to the HOA.
If you want to judge roofs and drainage under real conditions, start with touring between November and March, because that's when nearly all of San Jose's rain falls.
If you want a single-family home during the dry season, start by lining up roof, drainage, and cooling checks before you write an offer, because single-family homes sold in a median 17 days, leaving little time once you're under contract.
If you want cooler summer afternoons, start by comparing bay-side areas in the north of the city against foothill areas at the same late-afternoon hour. You can weigh these weather factors against housing costs by reviewing the broader pros and cons of living in the city.
At a glance
- Single-family homes, 90 days ending 2026-09-30: median 17 days on market, 101.9% sale-to-list, 48.4% sold above list, 1.8 months of supply
- Condos, 90 days ending 2026-09-30: median 42 days on market, 98.6% sale-to-list, 19.7% sold above list, 3.6 months of supply, median sale price $634,935 (down 9.2% year over year)
- Townhouses, 90 days ending 2026-09-30: median 24 days on market, 101.2% sale-to-list, 49% sold above list, median sale price $960,011 (down 9.4% year over year)
- All homes, 90 days ending 2026-09-30: median sale price $1,349,357 (down 5% year over year), median 22 days on market
San Jose weather patterns FAQs
How many rainy days are there in San Jose per year?
San Jose averages 59 days per year with measurable precipitation of 0.01 inches or more. Most of those rainy days fall between November and March. January alone averages 10.2 days with measurable precipitation.
What's the coldest month in San Jose?
January is the coldest month, with a normal high of 59.0°F and a normal low of 43.3°F. Frosty mornings are possible in low-lying spots across the valley. If you're buying in these cooler neighborhoods, check how a home is insulated.
Does San Jose have high humidity?
Humidity levels shift depending on the time of day and the season. Morning relative humidity typically differs from afternoon levels, and summer feels different than winter. Check local weather data for current relative humidity figures.
Does it snow in San Jose?
Snow on the valley floor is extremely rare. Over 100 years of records show only a handful of well-documented occurrences, and recorded amounts have never exceeded one inch. Nearby peaks like Mount Hamilton occasionally get a dusting during cold winter storms.
Why is it so windy in San Jose in the afternoon?
Afternoon high temperatures in San Jose are tempered by a sea breeze blowing off San Francisco Bay. Assuming weak to moderate onshore flow, this breeze pulls cooler air into the valley, which is what creates the typical afternoon winds you'll notice in spring and summer.
Will the 2026-27 rainy season be wet in San Jose?
As of October 26, 2026, NOAA reports a strong-to-very-strong El Niño in place, and the seasonal outlook favors above-average precipitation for California through early 2027. There's an 83% chance of this pattern persisting through the winter. Outlooks shift, and actual rainfall swings from year to year.
Is San Jose warmer than San Francisco?
Yes. San Jose runs warmer because it sits farther from the ocean and its cooling fog. San Francisco's downtown station shows a February normal high of 60.4°F, while San Jose's normal high for the same month is 62.8°F. The gap widens in summer, with San Jose reaching normal highs in the low 80s.
Is San Jose's weather a pro or a con of living there?
The mild winters and dry, sunny summers are generally considered pros. The cons include late-summer heat waves, occasional wildfire smoke from regional fires, and severe drought years. Weigh those weather patterns against housing costs and commute times when deciding where to land.
Sources
- Redfin: Data Center
- NOAA NCEI: Monthly Climate Normals (1991-2020) San Jose, CA
- Extreme Weather Watch: Average Rainfall by Month in San Jose
- Current Results: Average Yearly Precipitation in California
- NOAA NCEI: Monthly Climate Normals (1991-2020) San Francisco Downtown, CA
- Plantmaps: Köppen Climate Classification Map for San Jose
- National Weather Service: Climate of San Jose
- National Weather Service: San Jose Airport Climate Summary
- Valley Water: Coyote Creek Flood Protection Project
- Bay Area Air Quality Management District: Current Air Quality Status
- NOAA Climate Prediction Center: ENSO Evolution, Status, and Prediction
- California Energy Commission: Building Climate Zones