Is San Jose, CA safe? Crime Data and How to Check an Address (2026)
Citywide crime rankings in San Jose, CA do not reflect the safety of your exact address. Check CrimeMapping, hazard zones, and the NHD before making an offer.
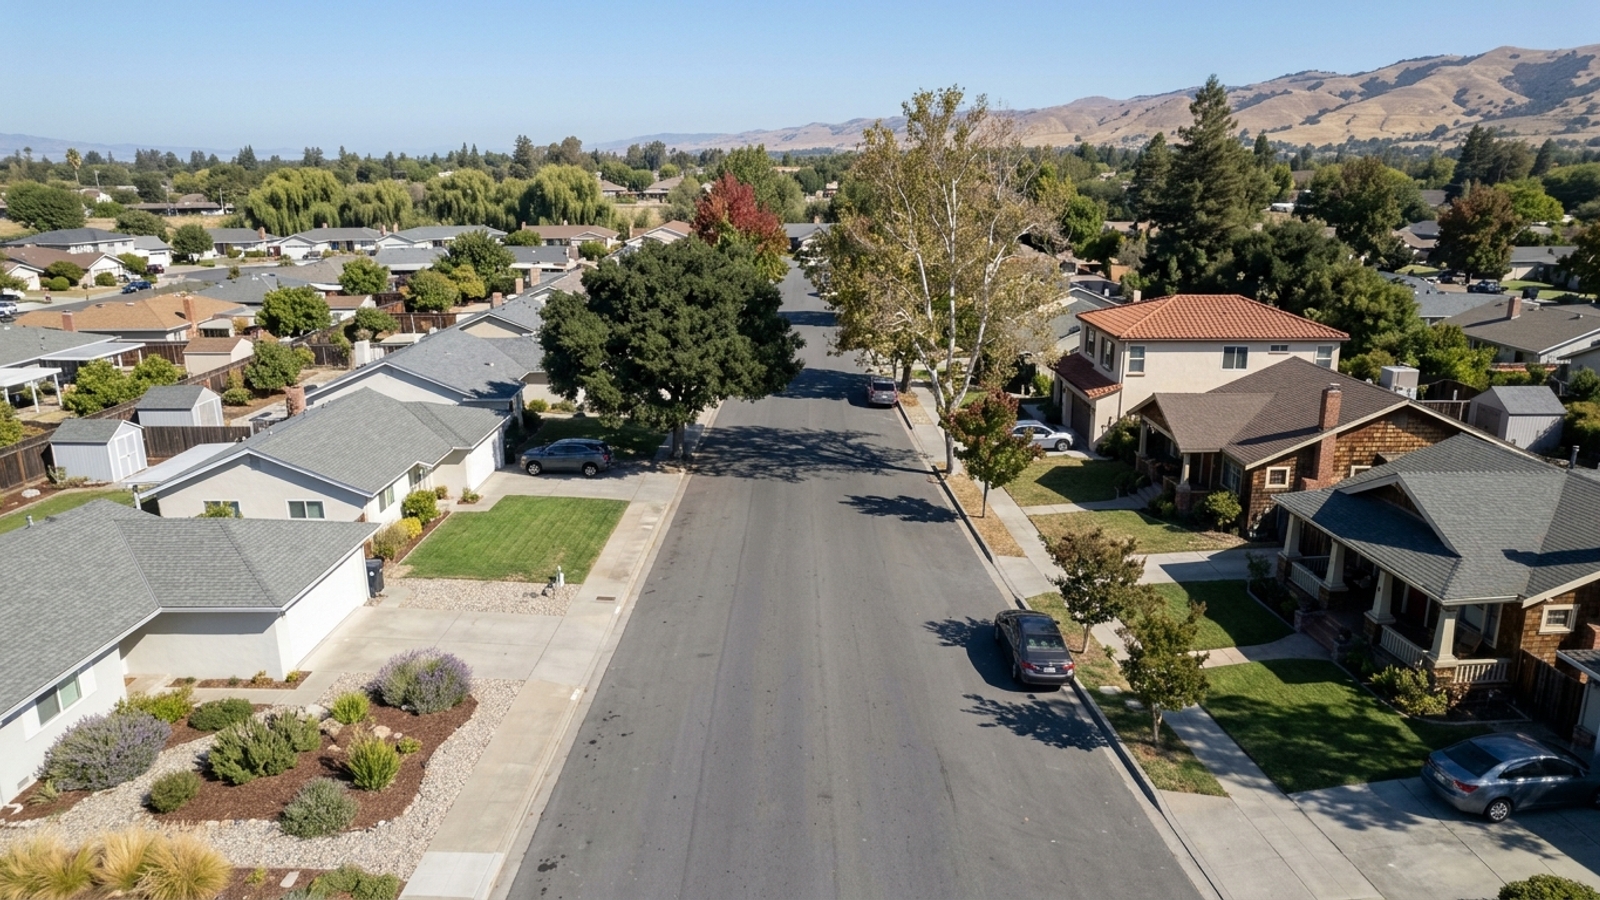
No city-wide ranking settles whether San Jose is safe for the home you're buying. That answer comes address by address from official crime, flood, fire, and seismic records.
The local housing market dictates how long you get to run these checks. Single-family homes recently sold above list price over the 90 days ending September 30, 2026, with nearly half going over asking. If you're looking at those homes, finish your research before making an offer. Condo buyers have more breathing room to verify details and negotiate.
Key Takeaway
San Jose's official crime data gives a city-wide picture, but the answer that matters for a purchase comes from checking the specific address for crime reports, hazard zones, and the seller's Natural Hazard Disclosure. If you're buying a single-family home, run those checks before you tour, because those homes sold in a median 17 days over the 90 days ending September 30, 2026. If you want more time to verify after you find a place, condos are selling more slowly and leave room to check and negotiate.
Who This Guide Is For
You're considering buying a home in San Jose and want to judge safety from official data before you commit to a specific address.
City-Wide Crime Data in San Jose, CA
San Jose recorded 4,963 violent crimes and 23,222 property crimes in 2025, according to FBI Uniform Crime Report figures reported by the San Jose Police Department. The 2025 violent-crime total marked the second consecutive annual decline after peaking at 6,046 in 2023. Property crime totals that year were the lowest in a decade, excluding the pandemic-affected 2021 counts.
Violent crime fell 15% in 2025 compared to 2024, while property crime dropped 7%. That included declines across aggravated assault, robbery, burglary, and motor vehicle theft. The San Jose Police Department and San Jose Fire Department serve the city. A city-wide downward trend doesn't mean any single block moves in lockstep.
What the Safest Large City Ranking Measured
A September 2025 report by financial tech company SmartAsset ranked San Jose as the safest large U.S. city. The report ranked the 50 largest cities by weighing the violent crime rate, property crime rate, vehicular mortality rate, drug overdose death rate, and excessive drinking rates. It used statistics from the FBI's 2023 Uniform Crime Reporting Database and 2025 County Health Rankings.
City-wide per-capita rankings average a very large municipality into one number, and they shift based on which crimes and which year are counted. A strong ranking says nothing about the specific address you're considering.
How to Verify Safety for a Specific San Jose Address
Real estate agents don't characterize an area's safety under Fair Housing rules, so you'll need to go directly to police and government data. The most accurate picture of a property comes from a step-by-step check using official sources.
These checks cover recent police incidents, mapped environmental hazards, and mandated seller disclosures. Running this process yourself means you'll have concrete facts before entering a binding contract.
Check Crime Reports Near the Address
The San Jose Police Department uses CrimeMapping.com to share automated extracts from its Records Management System. The map refreshes daily at 1:01 AM, letting you query crime data covering the 180 days prior to your request date. Review several months of data and read specific incident types and dates rather than relying on a single total count.
Look up the address on CrimeMapping.com alongside the department's citywide crime statistics page. Then visit the address yourself, once on a weekday morning and once after dark. Incident maps show reported incidents only, often place them at the block level rather than the exact location, and can swing month to month.
Check Flood, Fire and Earthquake Zones
This is where an address-level check gets genuinely specific. Enter the address on the FEMA Flood Map Service Center and check the Valley Water flood information for the property. For fire risk, CAL FIRE released updated Fire Hazard Severity Zone recommendations for San Jose's Local Responsibility Area in February 2025, classifying zones as Moderate, High, or Very High based on fire weather and fuel loading.
Santa Clara County directs residents to the California Geological Survey's statewide portals to check Earthquake Fault Zones and Seismic Hazard Zones. A zone designation changes insurance cost and availability, so get homeowners and earthquake insurance quotes during your contingency period. A standard California homeowners policy doesn't cover earthquake damage; that requires separate earthquake coverage. The insurance quote will tell you what the risk costs, which is often more useful than the map alone.
Read the Natural Hazard Disclosure
California sellers must hand buyers a statutory Natural Hazard Disclosure Statement covering mapped flood, fire, and earthquake hazard zones. Under California Civil Code §1103.2(a), this document details whether the home sits in special flood hazard areas, dam inundation areas, very high fire hazard severity zones, or seismic hazard zones.
Ask the listing agent for the Natural Hazard Disclosure and any inspection reports before you write an offer. In a fast-moving market, the data shows single-family homes selling in a median 17 days, leaving just days to act on what the document shows if you wait until after an offer is accepted.
How Much Time the San Jose Market Gives You to Check
The pace of the market dictates how long you have to verify property details. Single-family homes sold at 101.9% of list price over the 90 days ending September 30, 2026, with 48.4% going over asking. If you want a single-family home without rushing your safety checks, run your crime and hazard lookups before you tour.
Condos took a median 42 days to sell at 98.6% of list price after a 9.2% year-over-year price drop during that same 90-day window, which gives you time to run every address and building check after you find a place and still verify and negotiate during escrow. Townhouse prices fell 9.4% year over year, yet 49% still sold above list. The price drop hasn't bought buyers extra time there.
If you want a townhouse because prices have come down, time your checks as early as you would for a single-family house. For any attached home, ask the HOA what security measures the building has and whether they've changed recently. You should also ask whether the building has had a seismic retrofit, whether the master policy includes earthquake coverage, and request the latest reserve study and current dues.
Which Safety Checks to Start With
If you already have specific addresses in mind, go straight to the crime reports, hazard zones, and disclosures for those properties. If you don't, start with the city-level numbers to understand the broader trends.
Your property type decides whether checks happen before touring or during escrow. If the home is near a creek, on a hillside, or close to the bay, prioritize the flood, fire, and earthquake zones first. For homes in a building with an HOA, use the association questions to verify structural and policy details.
Next Steps for Buying in San Jose
Buyers who understand the local housing market and the buying process can time their disclosures and contingencies correctly. You can review the pros and cons of living here to gauge the cost of living, or look at different condo and townhome types to see what fits your budget.
You can also explore neighborhoods for amenities and housing options, or use local zip codes for your address lookups. Andy Tse can help request disclosure packages and inspection reports before an offer is written, giving you the facts you need to proceed.
At a Glance
- All homes: median sale price $1,349,357, down 5% year over year, 1,489 sales (90 days ending 2026-09-30)
- Single family: median sale price $1,620,854, down 2.6% year over year (90 days ending 2026-09-30)
- Single family: median 17 days on market, 101.9% sale-to-list, 48.4% sold above list (90 days ending 2026-09-30)
- Single family: 1.8 months of supply, 597 homes in inventory, median $956 per sq ft (90 days ending 2026-09-30)
- Condo: median sale price $634,935, down 9.2% year over year, 264 sales (90 days ending 2026-09-30)
- Condo: median 42 days on market, 98.6% sale-to-list, 19.7% sold above list (90 days ending 2026-09-30)
- Condo: 3.6 months of supply, 308 homes in inventory, median $586 per sq ft (90 days ending 2026-09-30)
- Townhouse: median sale price $960,011, down 9.4% year over year, 173 sales (90 days ending 2026-09-30)
- Townhouse: median 24 days on market, 101.2% sale-to-list, 49% sold above list, 2.7 months of supply (90 days ending 2026-09-30)
San Jose Safety FAQs
Is San Jose Safe to Walk Around at Night?
No official source rates nighttime safety for the city. To evaluate a specific route, review CrimeMapping.com for the address over several months, then walk the street yourself after dark to see the lighting and activity levels firsthand.
How Does San Jose's Crime Rate Compare with the California Average?
Based on FBI Uniform Crime Reporting agency-level data, San Jose's violent crime rate was 391.0 per 100,000 residents in 2023. That was 7% above the U.S. national average of 363.8 that year, and 24% below the California statewide average of 511.5 per 100,000 residents.
Is San Jose Safe from a Tsunami?
The California Geological Survey and Cal OES issued an updated Tsunami Hazard Area Map for Santa Clara County in July 2021. The agency noted that the tsunami hazard is slightly higher in the south bay, but residential and commercial areas near the bay are protected by levees and ponds. Check the state's hazard map to see if your property falls in a mapped hazard area.
Is San Jose Safe to Visit?
City-level crime data provides a general picture, but visitors should check the specific area around their hotel or venue using CrimeMapping.com. If you need assistance during your visit, the San Jose Police Department's non-emergency line is (408) 277-8900, and emergencies are 911. You can also file online crime reports through the department's system for certain specific incident types.
What Is San Jose's Safety Rating?
CrimeGrade gives San Jose an overall C+ grade, which blends violent, property, and other crime metrics. The city ranks in the 54th percentile nationally, meaning it's safer than 54% of U.S. cities and less safe than 46%. Aggregator grades like this are modeled estimates; police and FBI counts serve as the official record.
What Is the Population of San Jose?
The U.S. Census Bureau estimates the population of San Jose at 989,814 as of July 1, 2025. Population is the denominator in every per-capita crime rate, which is why rates rather than raw counts provide a fair comparison between cities.
Is San Jose Considered Wealthy?
The median sale price for all homes in San Jose is roughly $1,349,357 based on 1,489 sales over the 90 days ending September 30, 2026, down 5% year over year. You can check the local housing market trends to see how these values fluctuate by property type.
What Are the Downsides of Living in San Jose?
The high cost of housing is a primary downside, with single-family homes selling for a median $1,620,854 over the 90 days ending September 30, 2026. Buyers face steep competition and fast market times for these properties. You can compare the full list of cost of living factors and trade-offs to see how they fit your budget.
Sources
- Redfin: Data Center
- San Jose Spotlight: Reported crime in San Jose fell in 2025
- NBC Bay Area: San Jose crime 2025
- NBC Bay Area: San Jose safest large city
- CodeOpX: Crime data California San Jose
- San Jose Police Department: CrimeMapping.com
- California Legislative Information: Government Code Section 51179
- Santa Clara County: Geologic hazard maps and data
- California Legislative Information: Civil Code Section 1103.2
- California Earthquake Authority: Standard Homeowners Policy Sample
- California Department of Conservation: CGS issues new tsunami hazard maps
- U.S. Census Bureau: QuickFacts San Jose city, California
- CrimeGrade: Safest places in San Jose, CA
- San Jose Police Department: Report crimes online